Examples
A collection of examples of how to use react-simple-maps to create various mapcharts, maps with labels, markers, lines and annotations.
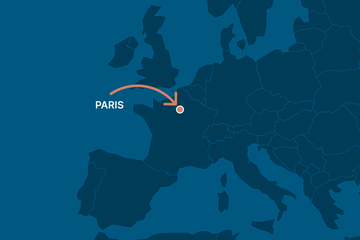
Basic annotation
An example of a simple annotation using the react-simple-maps built-in annotation component.
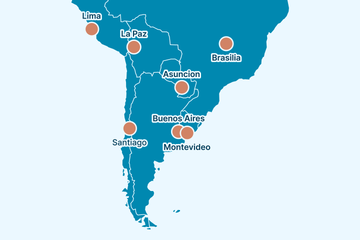
Basic markers
The capitals of countries in South America displayed as basic markers.
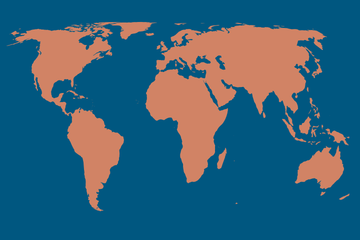
Basic world map
A world map showing countries based on Natural Earth data.
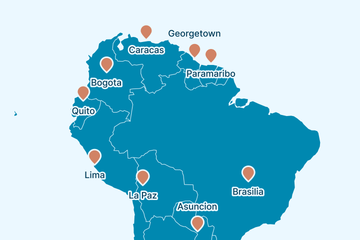
Custom markers
The capitals of countries in South America displayed as custom SVG markers.
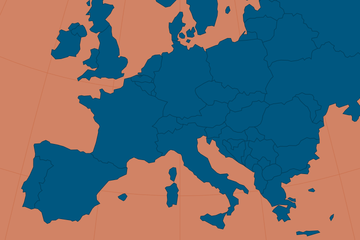
Europe map with graticule
A map of Europe using the built-in geoAzimuthalEqualArea projection with custom rotation parameters.
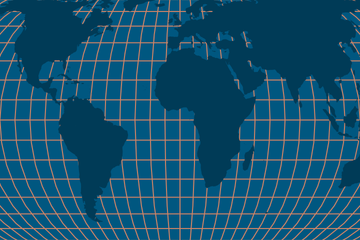
Graticule
A world map with a graticule using the graticule component.
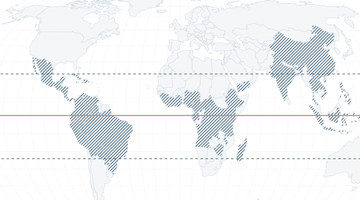
Mapchart with texture
Map chart showing the top coffee producing countries in the world.
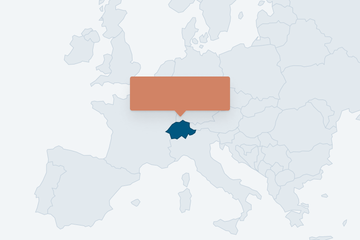
Mapchart with tooltip
Map chart showing a world map with tooltips using react-tooltip.
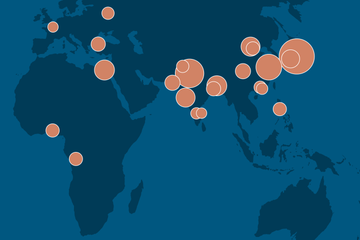
Proportional symbol map
30 largest cities in the world according to UN 2020 estimates
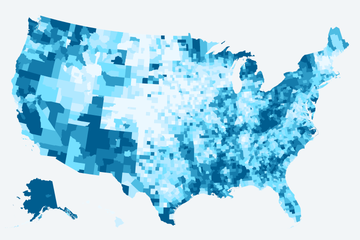
US choropleth map (quantile)
A map chart showing unemployment in the US at county level.
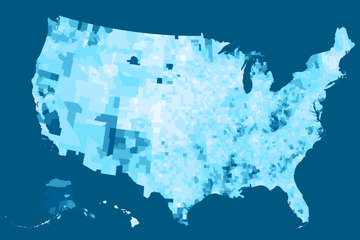
US choropleth map(quantize)
A map chart showing unemployment in the US at county level.
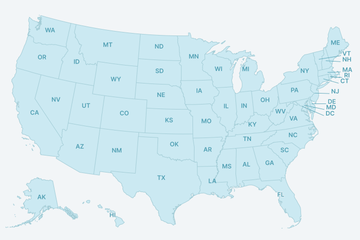
US states map with labels
A US map displaying states with labels using Markers and Annotations.
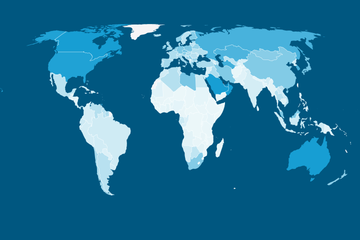
World choropleth mapchart
2020 CO2 emissions in metric tons per capita data from Climate Watch
Map with zoom and pan
World map with pinch zoom and pan enabled.
Newsletter
Sign up to the React Simple Maps newsletter and be the first one to know when we publish new stuff.
Contact us
React Simple Maps was created by z creative labs. We turn ideas into digital products and specialise in dataviz and data-driven design. Are you looking for someone to create custom mapcharts and data visualisations?
